Divorce remains a significant social and demographic indicator, and in California, its dynamics reflect the state’s diverse population, evolving families, and varied cultural landscapes. The California divorce rate has seen notable changes in recent years, offering insight into shifting societal norms and relationship patterns.
This article dives into the most recent data on divorce rates, county patterns, family structures with children, ethnicity, religion, political affiliation, same-sex couples, risk factors, and what these divorce trends mean for Californians today. If you're considering divorce or need guidance through the legal process, our California Board-Certified divorce attorneys are here to help you understand your rights and options.
Divorce Rate in California
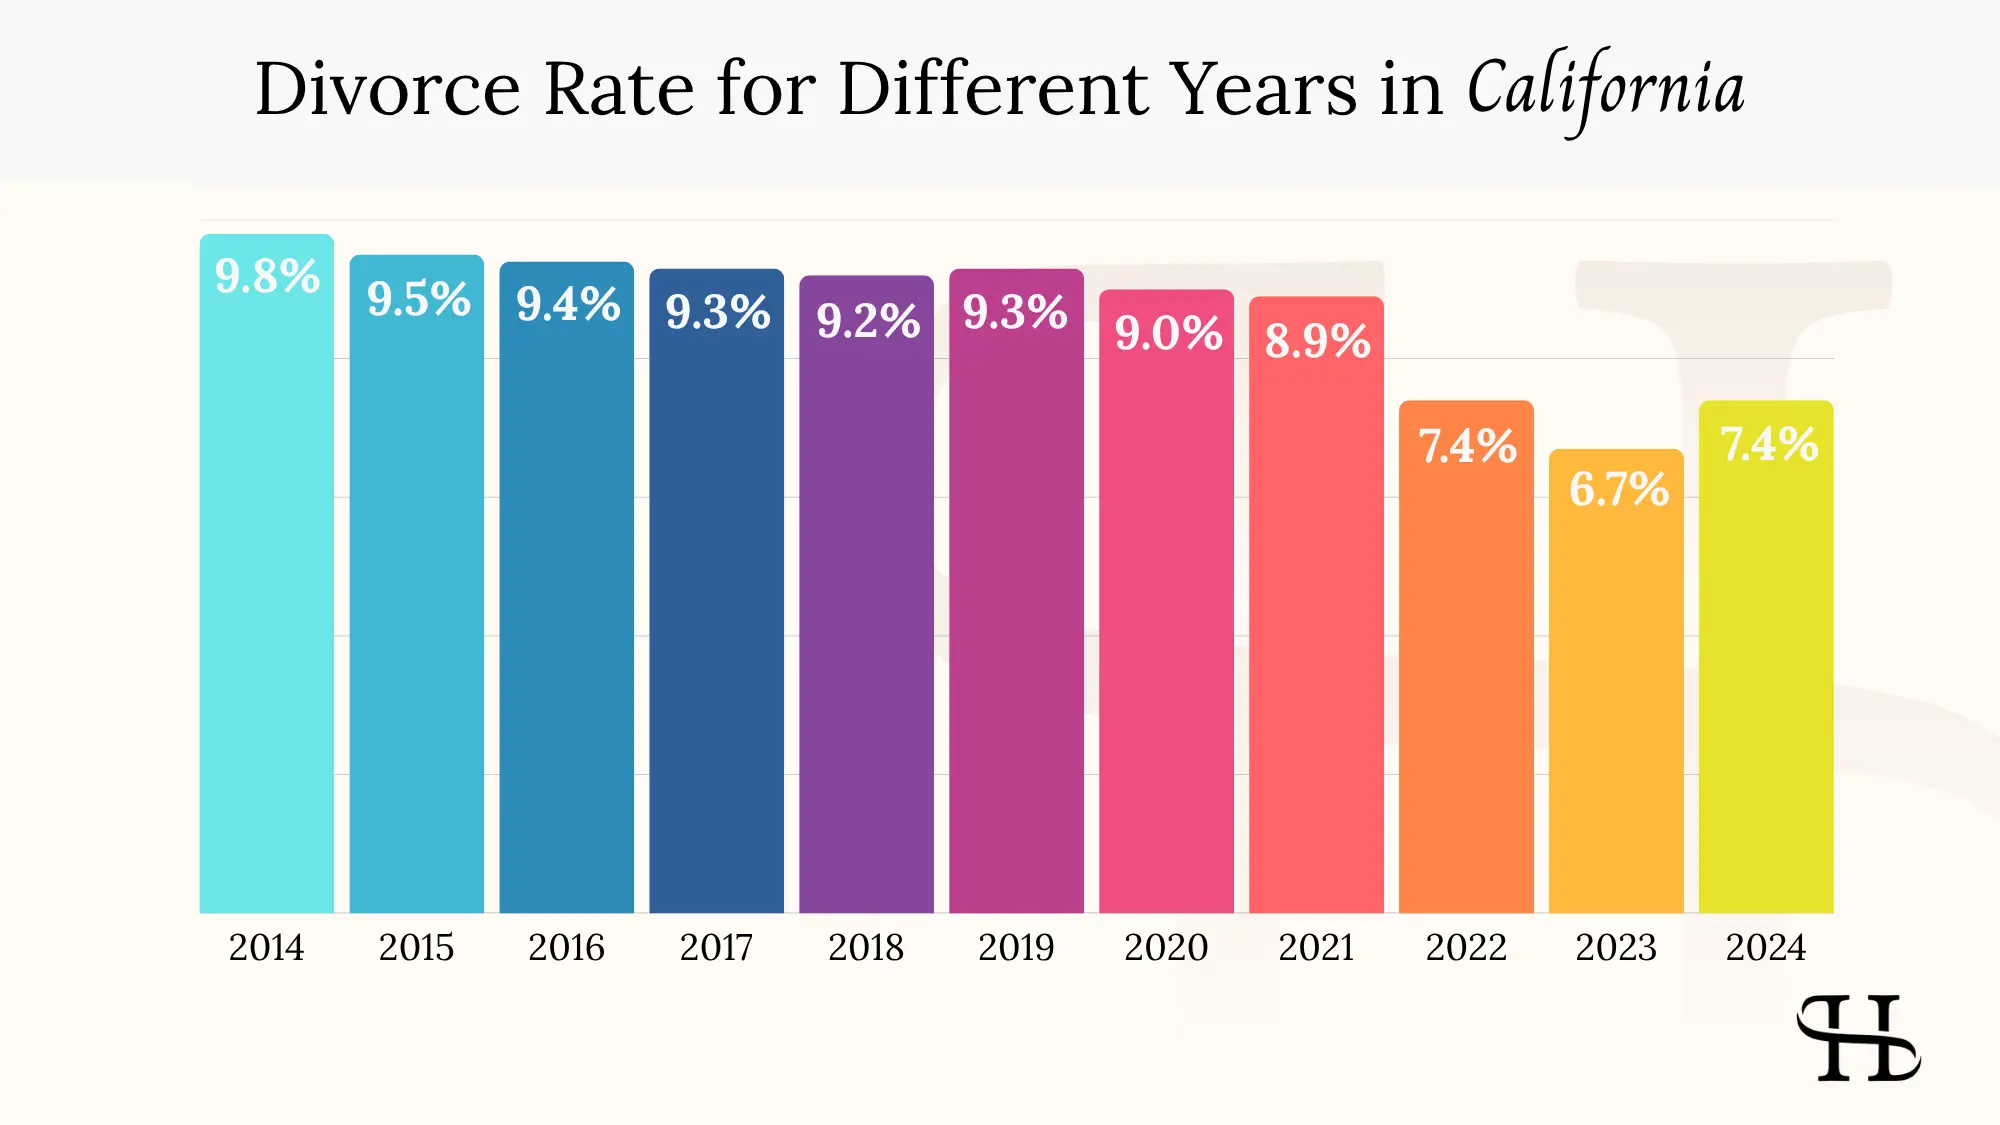
According to recent reports, there has been a steady decline in California's divorce rate, reflecting broader national trends. In 2022, the rate was approximately 7.4%, followed by a further drop to 6.7% in 2023. By 2024, the rate returned to 7.4%, continuing a pattern of fluctuation within an overall downward trend. These figures place California around 45th out of 50 states in divorce prevalence, highlighting its position among those with the lowest divorce rates in the country.
Other sources indicate the rate remains under 9%, down from approximately 9.8% in 2014 to 8.9% by 2021. This places California among the states with the lowest divorce rates in the country. Despite its large population, it does not have the highest number of divorces, highlighting a steady downward trend amid shifting marriage patterns.
Percentage of the Divorced Population in California Counties
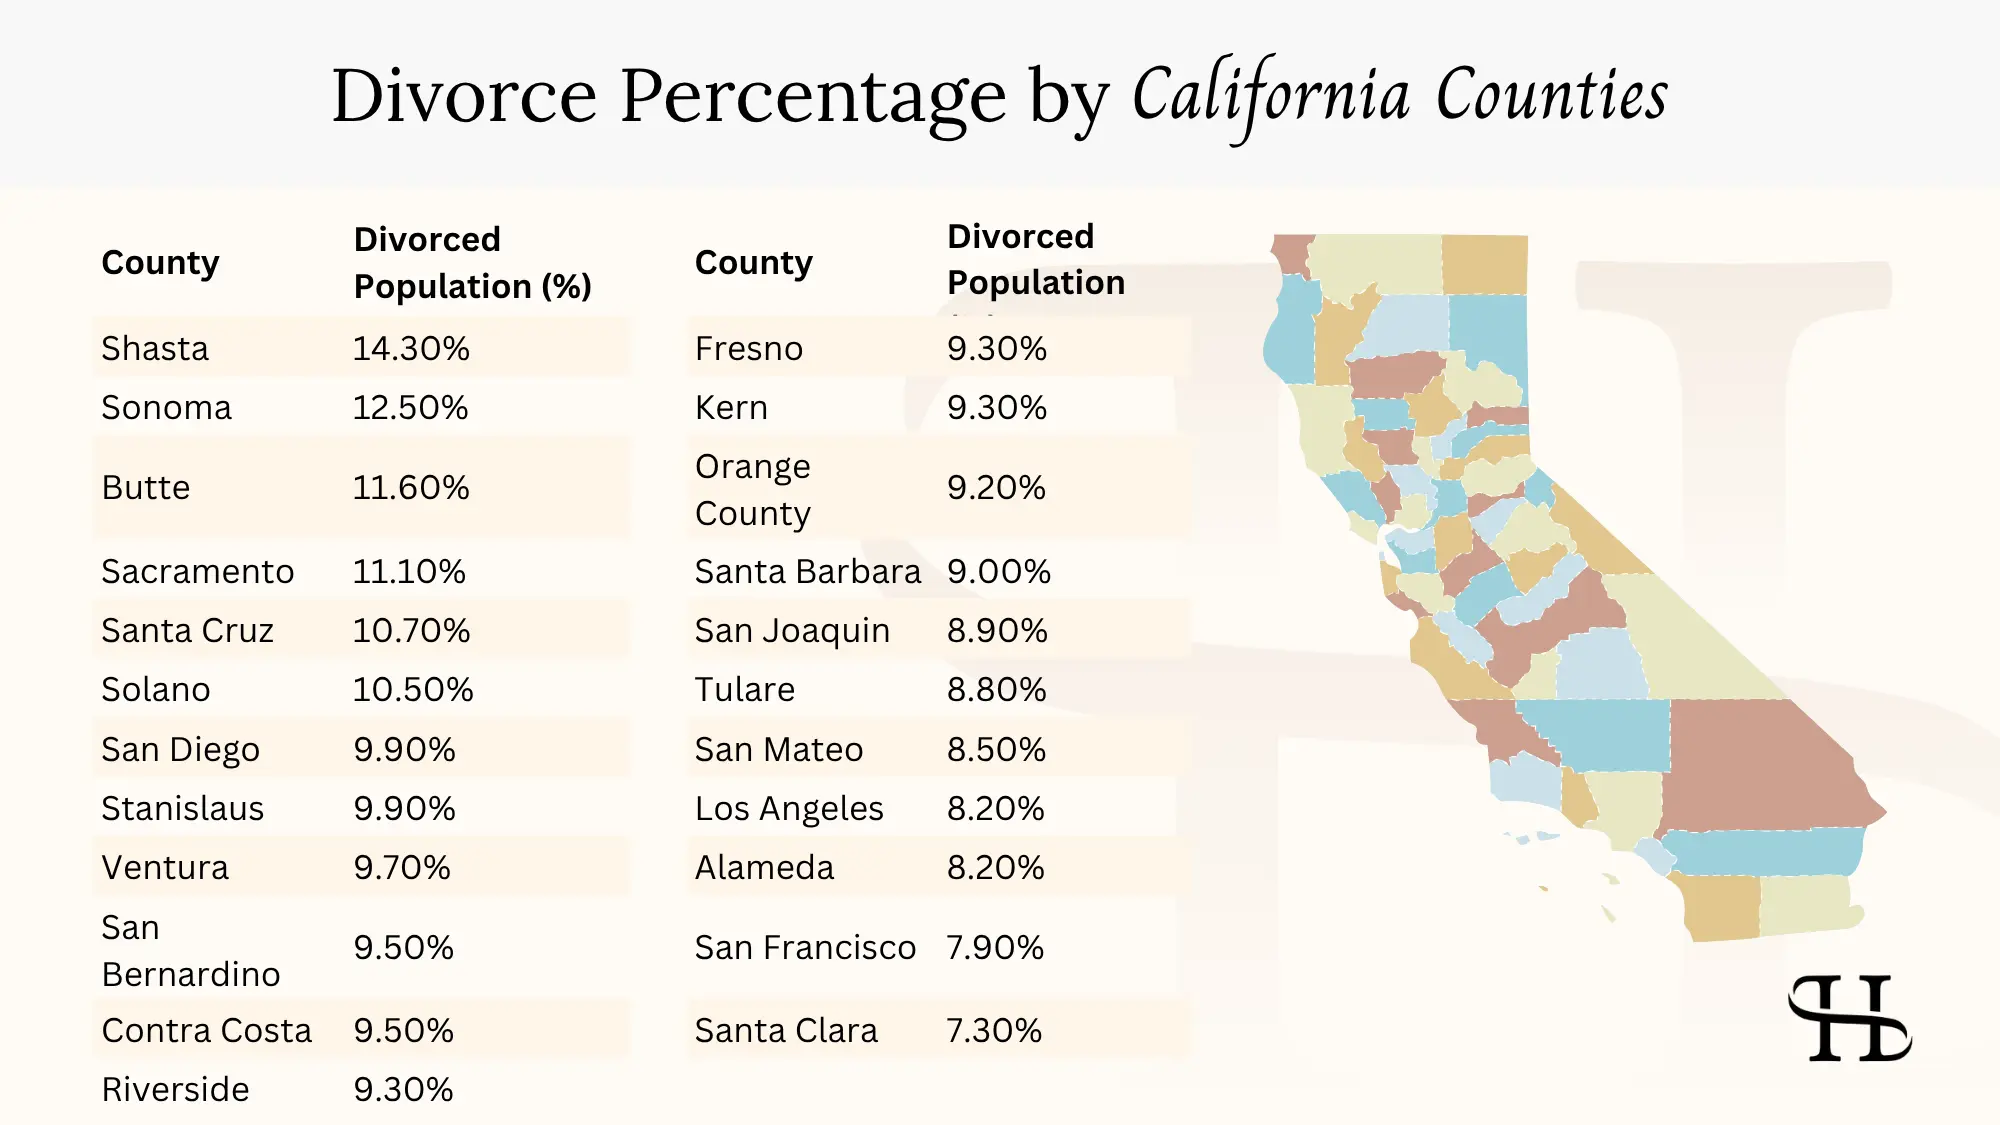
While official county-level divorce rates are limited, context from demographic surveys and census data offers insights. California consistently sits among the states with lower per-capita divorce rates. Counties such as Orange County and Los Angeles County often show higher divorce volumes due to their population size, not necessarily because of a higher rate.
Counties with higher divorce rates are often those with younger populations, lower median incomes, and higher rates of cohabitation. Unfortunately, consistent and recent county-by-county divorce data is not publicly aggregated across the state.
Divorce Statistics for Families with Kids in California
Nationally, divorce is 40% less likely among couples who have children together compared to those without. In California’s diverse population, couples with children tend to stay together longer, though second marriages involving children face a higher risk. Divorce can significantly impact the lives of both parents and children, making the decision to stay married or separate especially important for families.
Many couples with children make efforts to stay married for the stability and well-being of their children.

Divorce Statistics by Ethnicity in California
Divorce rates differ significantly by race and ethnicity. While California-specific statistics are limited, national data suggests:
- Black or African-American individuals have the highest divorce rates (~22–24%).
- Hispanic individuals: Around 11–15%.
- White individuals: Around 10–12%.
- Asian individuals: The lowest rates (~7–9%).
These trends likely carry over to California, especially given the state’s racial and ethnic makeup: approximately 39% Hispanic or Latino, 15% Asian, 5% Black, and 35% White (non-Hispanic). These groups experience varied cultural and socioeconomic pressures that influence marital stability. A variety of factors contribute to the differences in divorce rates among ethnic groups, including cultural expectations, economic conditions, and access to support systems.
Considering Divorce But Unsure Where to Start?Get Help Today.
Speak with our expert California divorce attorney who can walk you through your options — from child custody to property division — so you can move forward with clarity and confidence.
Divorce Statistics by Religion in California
Religious affiliation strongly influences divorce rates. Those with strong religious beliefs are statistically 14% less likely to divorce, while those unaffiliated with any religion face an increased risk.
Nationwide data shows:
- Evangelical Christians: ~26% divorce rate
- Catholics: ~28%
- Unaffiliated individuals: ~38%
In California, religious affiliation includes 28% Catholic, 20% Evangelical Protestant, 10% Mainline Protestant, and about 27% unaffiliated. Religious involvement often provides both social support and shared values that can protect marriages.
Many religious organizations also offer counseling services to help couples strengthen their marriages and address challenges before they lead to divorce.
Divorce Rates by a Political Party in California
Political ideology also shows a correlation with divorce risk. National studies indicate:
- Conservatives are the least likely to divorce (~28%)
- Moderates fall in the middle (~33%)
- Liberals show the highest rates (~37%)

Interestingly, individuals living in Republican-leaning states are about 27% more likely to divorce than those in Democratic-leaning ones. Since California is one of the most reliably Democratic states, this might suggest a slightly lower average divorce risk statewide, but the personal beliefs of individuals likely matter more than statewide political leanings.
Political beliefs and values can also influence when people choose to get married and their likelihood of staying married, affecting overall marriage and divorce trends.
Same-Sex Divorce Rates in California
Since marriage equality was established nationwide in 2015 with the U.S. Supreme Court’s decision in Obergefell v. Hodges, same-sex couples have been included in divorce statistics in California. Early trends show that:
- Same-sex couples tend to have similar or slightly lower divorce rates compared to opposite-sex couples.
- The average age at marriage for same-sex couples tends to be higher than for opposite-sex couples, and marrying at older ages is associated with lower divorce rates.
- Higher education levels among many same-sex couples may also contribute to greater stability, as both age and education are factors that influence divorce rates.
California cities like San Francisco, West Hollywood, and Palm Springs have large LGBTQ+ populations and high same-sex marriage rates, but exact divorce data for same-sex couples remains limited. If you're part of the LGBTQ+ community and considering divorce, working with our experienced divorce lawyer for LGBTQ couples can help you navigate the legal process with clarity and care.

Risk Factors for Divorce
Whether in California or elsewhere, several factors consistently increase divorce risk. These include:
- Previous marriages: Second marriages have a ~60% divorce rate; third marriages approach 70–75%.
- Gender and initiation: About 69% of all divorces are initiated by women.
- Education level: College graduates are significantly less likely to divorce in California.
- Age at marriage: Marrying before age 25 significantly raises divorce risk.
- Living together before engagement: This increases the likelihood of divorce by up to 40%.
- Family background: Children of divorced parents are up to twice as likely to divorce.
- Religious involvement: Active religious practice tends to reduce divorce risk.
- Substance abuse or addictions: Smoking, alcohol, and pornography use are linked to increased divorce risk.
- Finances: Frequent money arguments and financial instability are top predictors of divorce.
- Multiple daughters: Couples with three daughters are slightly more likely to divorce than those with sons.
While each marriage is unique, being aware of these factors can help couples identify areas of vulnerability and seek help early.
Navigating the Divorce Process in California with Confidence
California’s divorce rate is steadily declining, ranking among the lowest in the U.S. Still, many Californians face the difficult decision to file for divorce. If you’re considering legal separation or ending your marriage, it’s important to understand your rights and the legal process, and potential divorce costs — including court fees, attorney expenses, and child support obligations. Our experienced divorce attorneys are here to guide you through your divorce case with clarity and care. Book a free confidential consultation today to discuss your next step.
.avif)
.avif)